Introducing Patent pending
Spatial Forecasting
Forecast the wells together.
Every decline curve assumes the reservoir isn't shared. But it is. Spatial Forecasting models your wells together in one reservoir, so depletion and interference show up in every forecast: the PUDs you're planning and the PDP you already own.
New in Obsidian® by Upstream Edge
Wells don't produce independently. So why forecast them that way?
A new well changes what its neighbors produce, and that effect keeps changing as the reservoir depletes. Child wells perform differently and PUDs take from the PDP, but a forecast that only sees its own well can't quantify any of it.
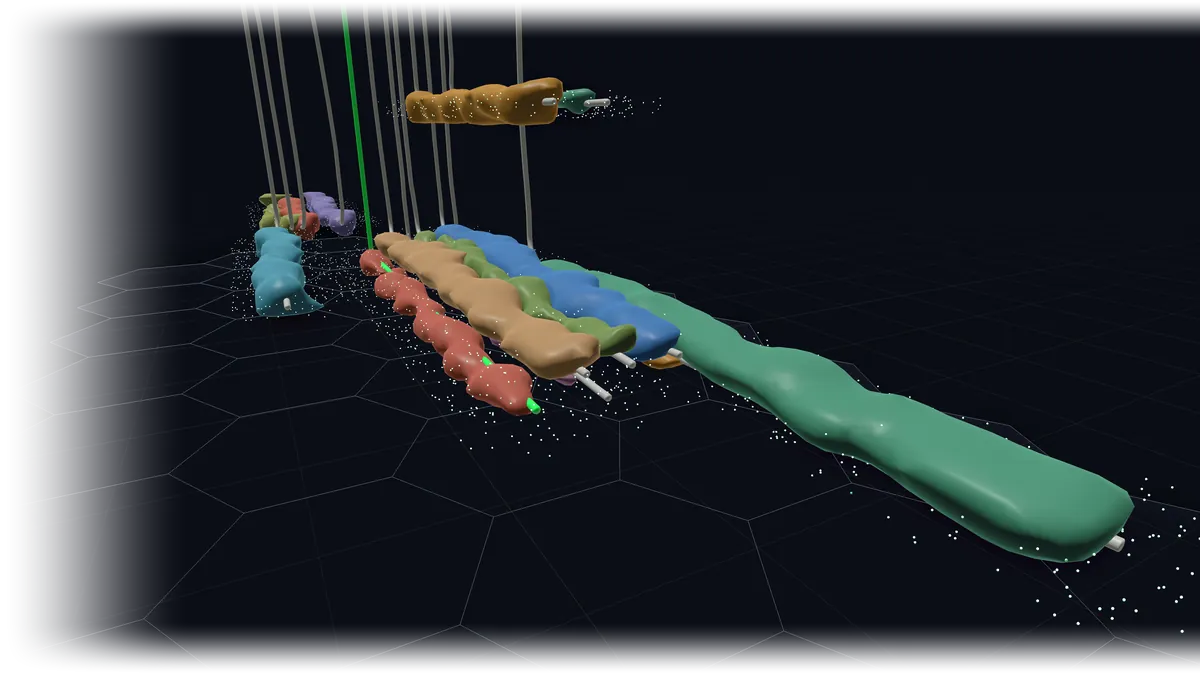
Spatial Forecasting models wells together, accounting for spacing, depletion, timing, and well-to-well interactions.
An offset well is drilled after this well's history ends. Standalone, fitted only to that history, can't see the depletion the new well causes.
These two wells are 500 ft apart.
What that 500 ft does to production, and what that production change does to value.
What does the new well do to the wells already producing, and what do they do to it?
Together, not one at a time
Every well draws from one shared model of the reservoir. Depletion and interference show up in the forecast because they show up in the model.
PDP and PUD together
The producing wells are forecast alongside the new ones. Place a PUD and see what it costs the wells you already own, and what they cost it.
Local and auditable
Calibrated to your own production history and tested blind against what came next. Your acreage, not a basin average.
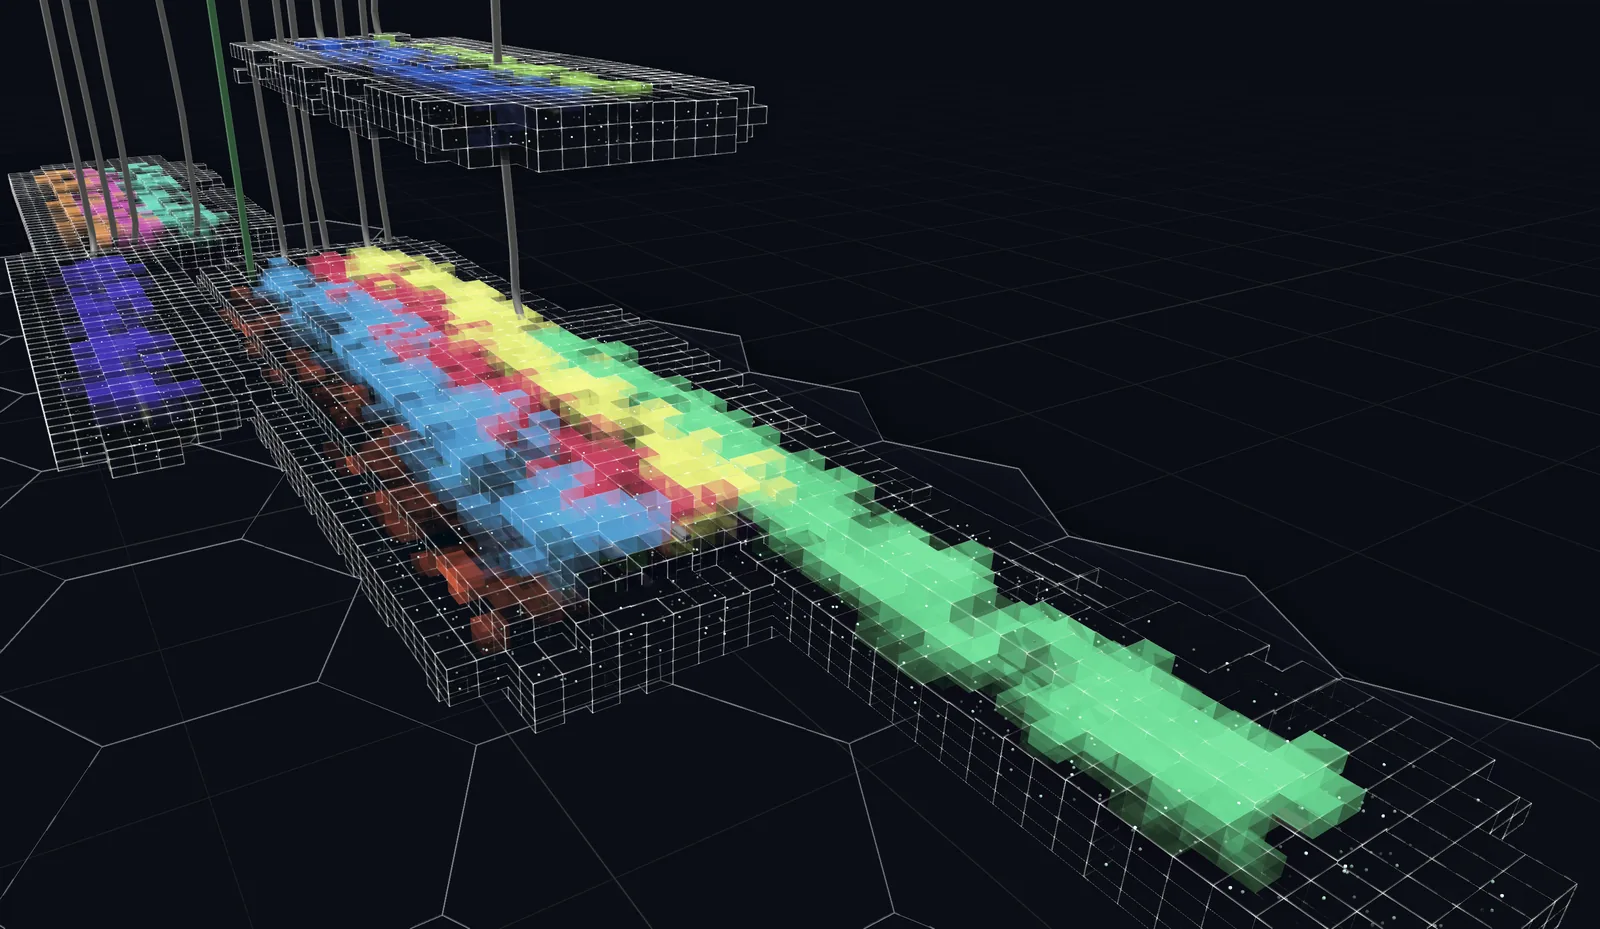
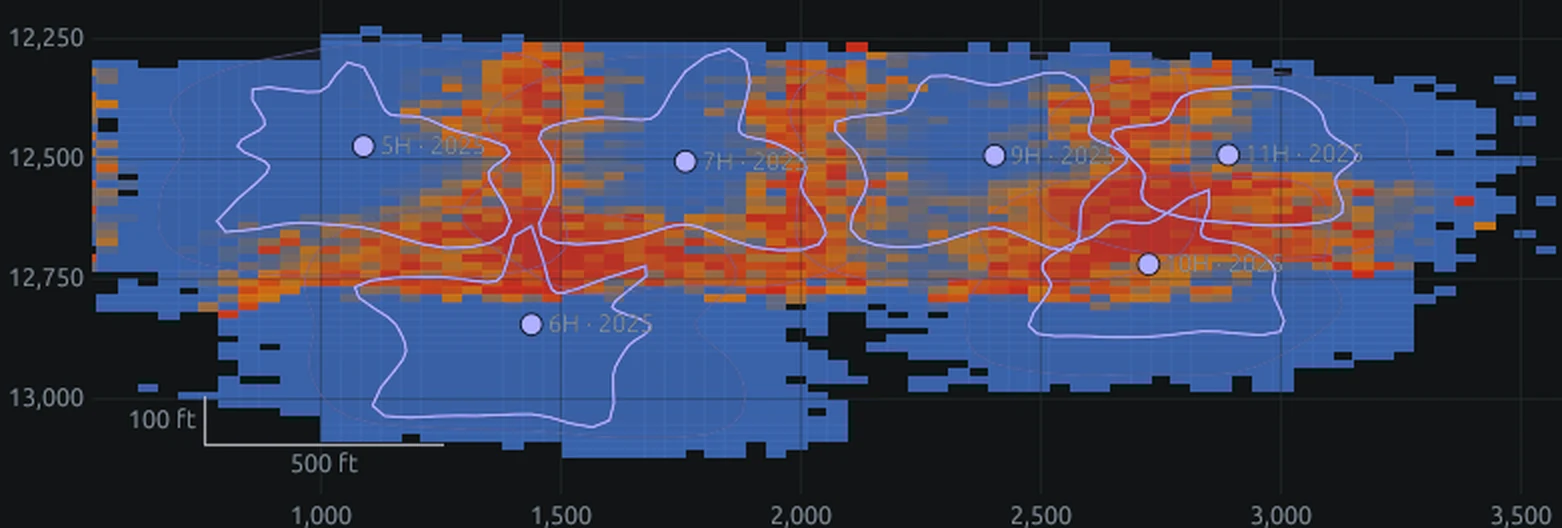
Where the reservoir drained, and which well drained it.
Every barrel is attributed to the well that drained it, so a shortfall traces back to the neighbor that took it.
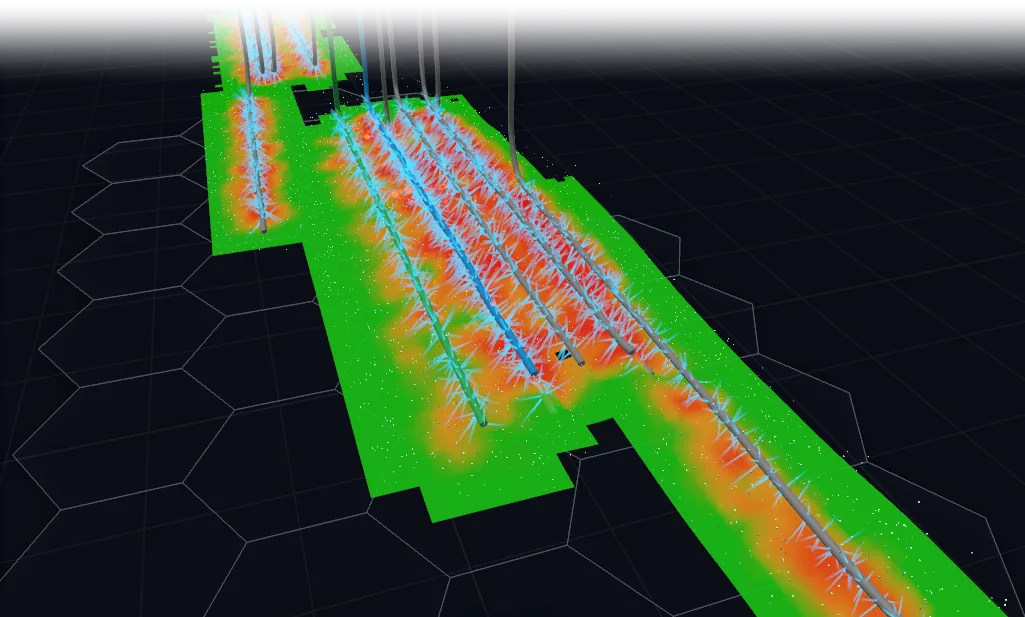
Move the PUD. See the PDP impact. Know the value.
Drag a PUD, change its spacing or timing, and see the new well's forecast, the offset PDP response, and the unit's production and economics side by side. In minutes, inside the same project you already forecast in.
- The new well's forecast
- The response of the PDP around it
- Unit production and economics, base vs. scenario
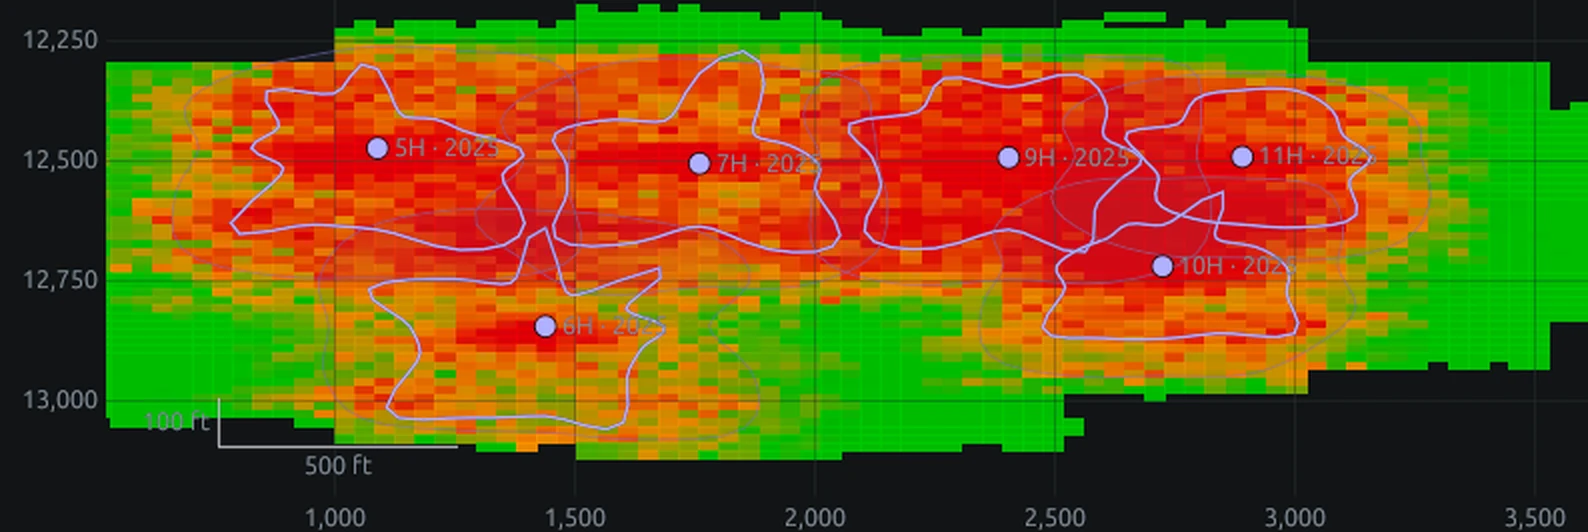
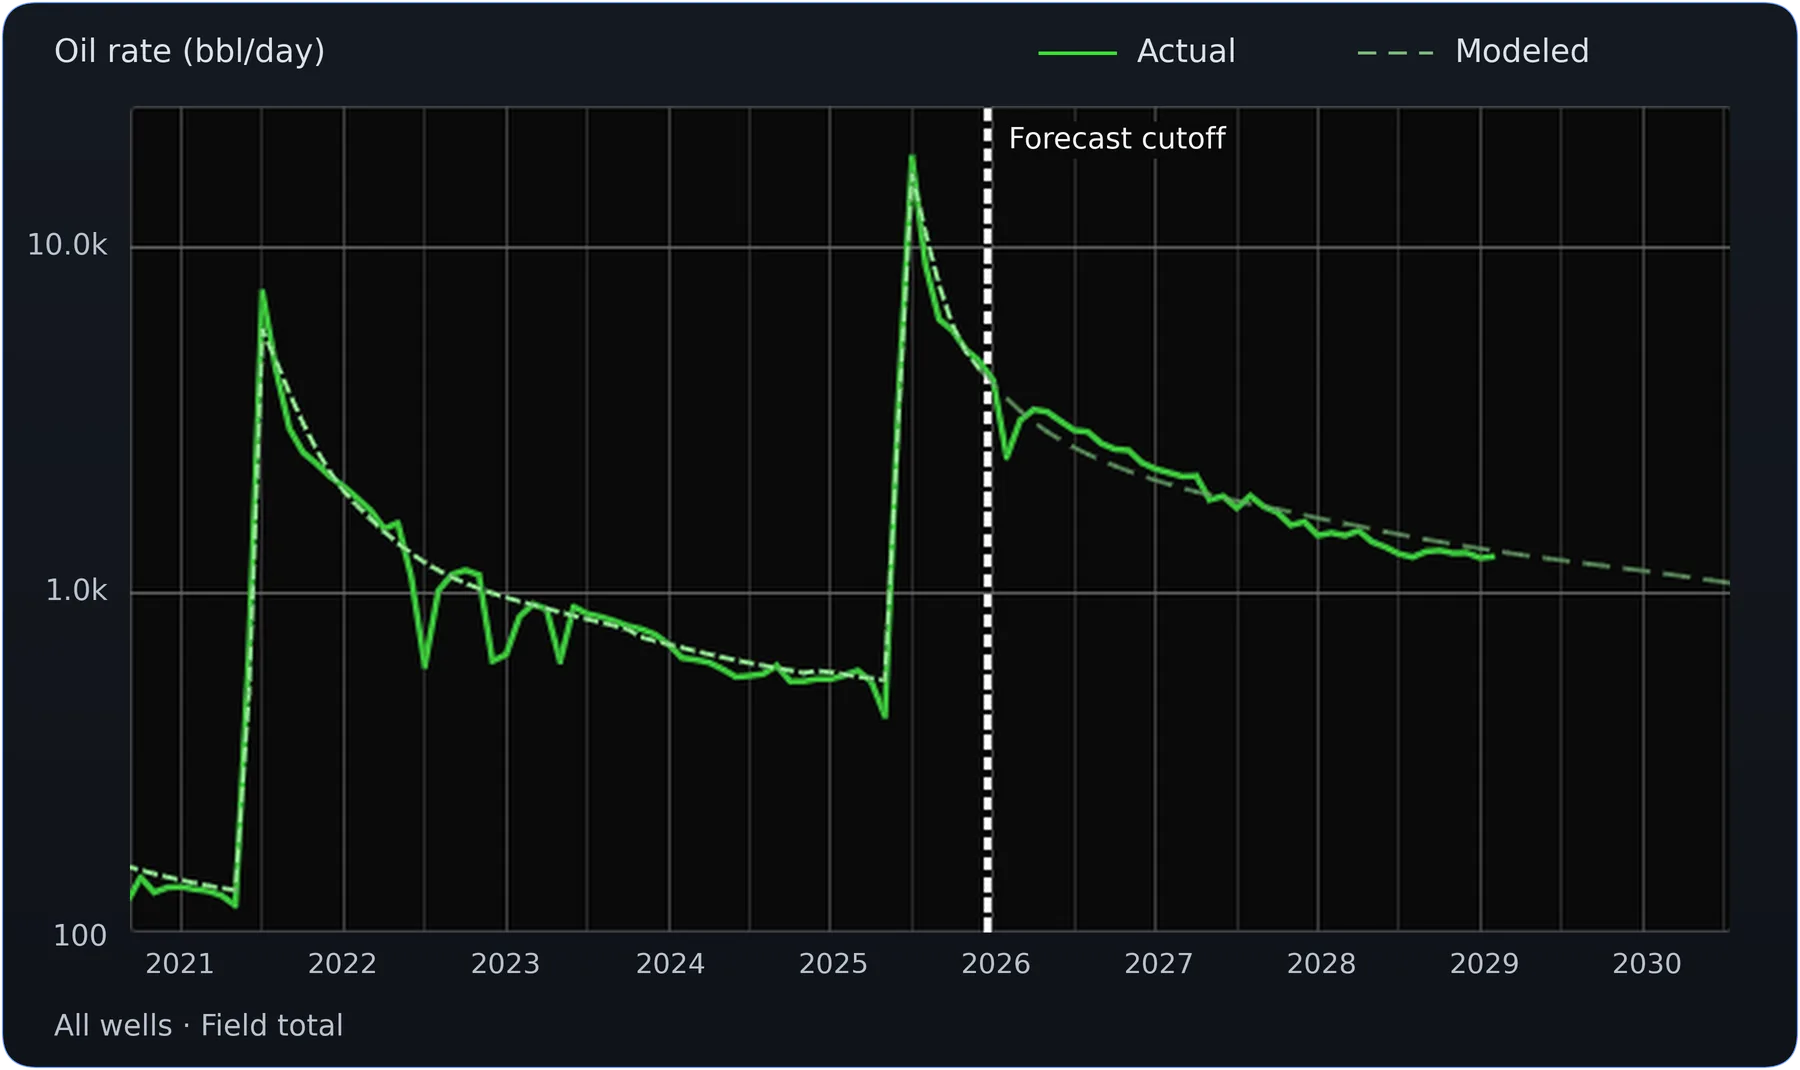
Calibrated to your history. Checked against what came next.
Before you trust a scenario, test the model. Hold back recent production, forecast forward from the cutoff, then check against what the wells actually did.
- The cutoff date is explicit
- The model never sees the held-back months
- Actuals revealed for each well and in total
Calibrate. Validate. Decide.
-
1
Calibrate
History-match the model to the production already in your Obsidian project.
-
2
Validate
Blind-backtest against held-back history before you trust a scenario.
-
3
Diagnose
See where the reservoir drained, and which well drained it.
-
4
Scenario
Move, space, or re-time a PUD and compare against the base case.
-
5
Decide
Production and economics side by side, in the same project.
Built from your data
The inputs most Obsidian projects already contain. Missing optional data doesn't stop the workflow.
Required
- Production history
- Well trajectories
- Timing and sequence
Optional
- Completion design (proppant and fluid)
A reserves forecast you rerun every quarter, not a study.
Spatial Forecasting runs inside Obsidian, the same project you already forecast, value, and report in. Spatial Forecasting results connect directly to Obsidian's forecasting and economics.
Explore Obsidian“Obsidian has completely transformed my reserves evaluation process. What used to take hours now takes just minutes.”
Frequently asked questions
What data does Spatial Forecasting need?
Production history, well trajectories, and timing — data most Obsidian projects already contain. Completion design (proppant and fluid) is optional, and used when provided.
Does it forecast my existing PDP, or only new wells?
Both. Spatial Forecasting forecasts every well together, producing and planned. Adding a PUD changes the forecasts of the PDP around it, and those wells change the PUD's forecast in return.
How can I tell whether a forecast really accounts for depletion?
Ask it one question: what does the new well do to the wells already producing, and what do they do to it? Answering that takes a forecast of every well, together, with drained volume attributed to the well that drained it. That is what Spatial Forecasting is built to do.
How is the model calibrated?
Spatial Forecasting takes the production and spatial data in Obsidian and calibrates the model to history match past behavior. By calibrating all wells at once, the well-to-well spacing impacts seen in production data can then be quantified and used for forecasting.
How do I know I can trust the forecast?
Blind backtesting. Pick a cutoff date, hide all production after it, let the model forecast forward, then reveal the actuals at both the well and aggregate level. We recommend running a backtest (on ANY forecasting approach) on your own asset before integrating it into your workflow.
How is this different from well spacing analysis?
Spacing analysis measures geometry: two wells are 500 feet apart. Spatial Forecasting quantifies what that 500 feet does to production over time, for the new well and the existing PDP around it, and carries the result through to economics.
Does it work with my existing Obsidian forecasts and economics?
Yes. Spatial Forecasting runs inside Obsidian, so results connect directly to Obsidian's forecasting and economics.
Can I test it on my own asset?
Yes, and it's the best way to evaluate it! We run a guided session on your data: calibrate, blind-backtest, then test a real spacing or PUD decision you're working on.